79190835
Date: 2024-11-15 01:03:53
Score: 1.5
Natty:
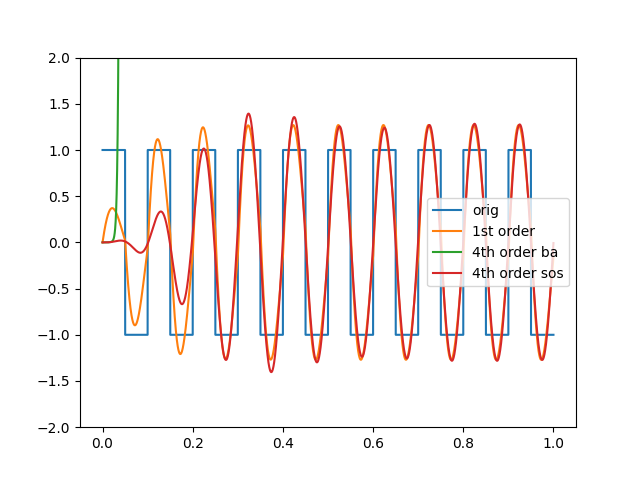
@Irreducible is correct. You have created filter coefficients that expose a numerical stability issue in the case of a 4th order Butterworth filter. As suggested, express the filter as second order sections and your filter will be fine:
import numpy as np
import scipy as sp
import matplotlib.pyplot as plt
from scipy import signal
fs=20000
bt,at= signal.butter(4,[7.692307692307693,13],'bandpass',fs=fs)
b1,a1= signal.butter(1,[7.692307692307693,13],'bandpass',fs=fs)

t = np.linspace(0, 1, fs, endpoint=False)
freq = 10
sqr_wave = signal.square(2 * np.pi * 10 * t)
plt.plot(t, sqr_wave,label='orig')
sqr_wave_1st_order = signal.lfilter(b1, a1, sqr_wave)
plt.plot(t, sqr_wave_1st_order,label='1st order')
sqr_wave_4th_order = signal.lfilter(bt, at, sqr_wave)
plt.plot(t, sqr_wave_4th_order,label='4th order ba')
sos_4th_order = signal.butter(4,[7.692307692307693,13],'bandpass',fs=fs,output='sos')
sqr_wave_sos = signal.sosfilt(sos_4th_order, sqr_wave)
plt.plot(t, sqr_wave_sos,label='4th order sos')
plt.ylim(-2, 2)
plt.legend()
plt.show()
Output:
Reasons:
Posted by: dmedine - Probably link only (1):
- Long answer (-1):
- Has code block (-0.5):
- User mentioned (1): @Irreducible
- Looks like a comment (1):