79195097
Date: 2024-11-16 12:01:12
Score: 1.5
Natty:
I just add geom_subtile() and geom_subrect() function in package ggalign to subdivide rectangles with shared borders into a grid.
library(reshape2)
library(ggplot2)
m <- matrix(
    c("SNV", "SNV", NA, NA, "INDEL", "SNV", "INDEL", "SNV", "SNV/INDEL"),
    3, 3
)

ggplot(
    tidyr::separate_longer_delim(melt(m), value, delim = "/"),
    aes(Var1, Var2, fill = value)
) +
    geom_subtile(color = "yellow", linewidth = 2) +
    xlab("Patient") +
    ylab("Gene")

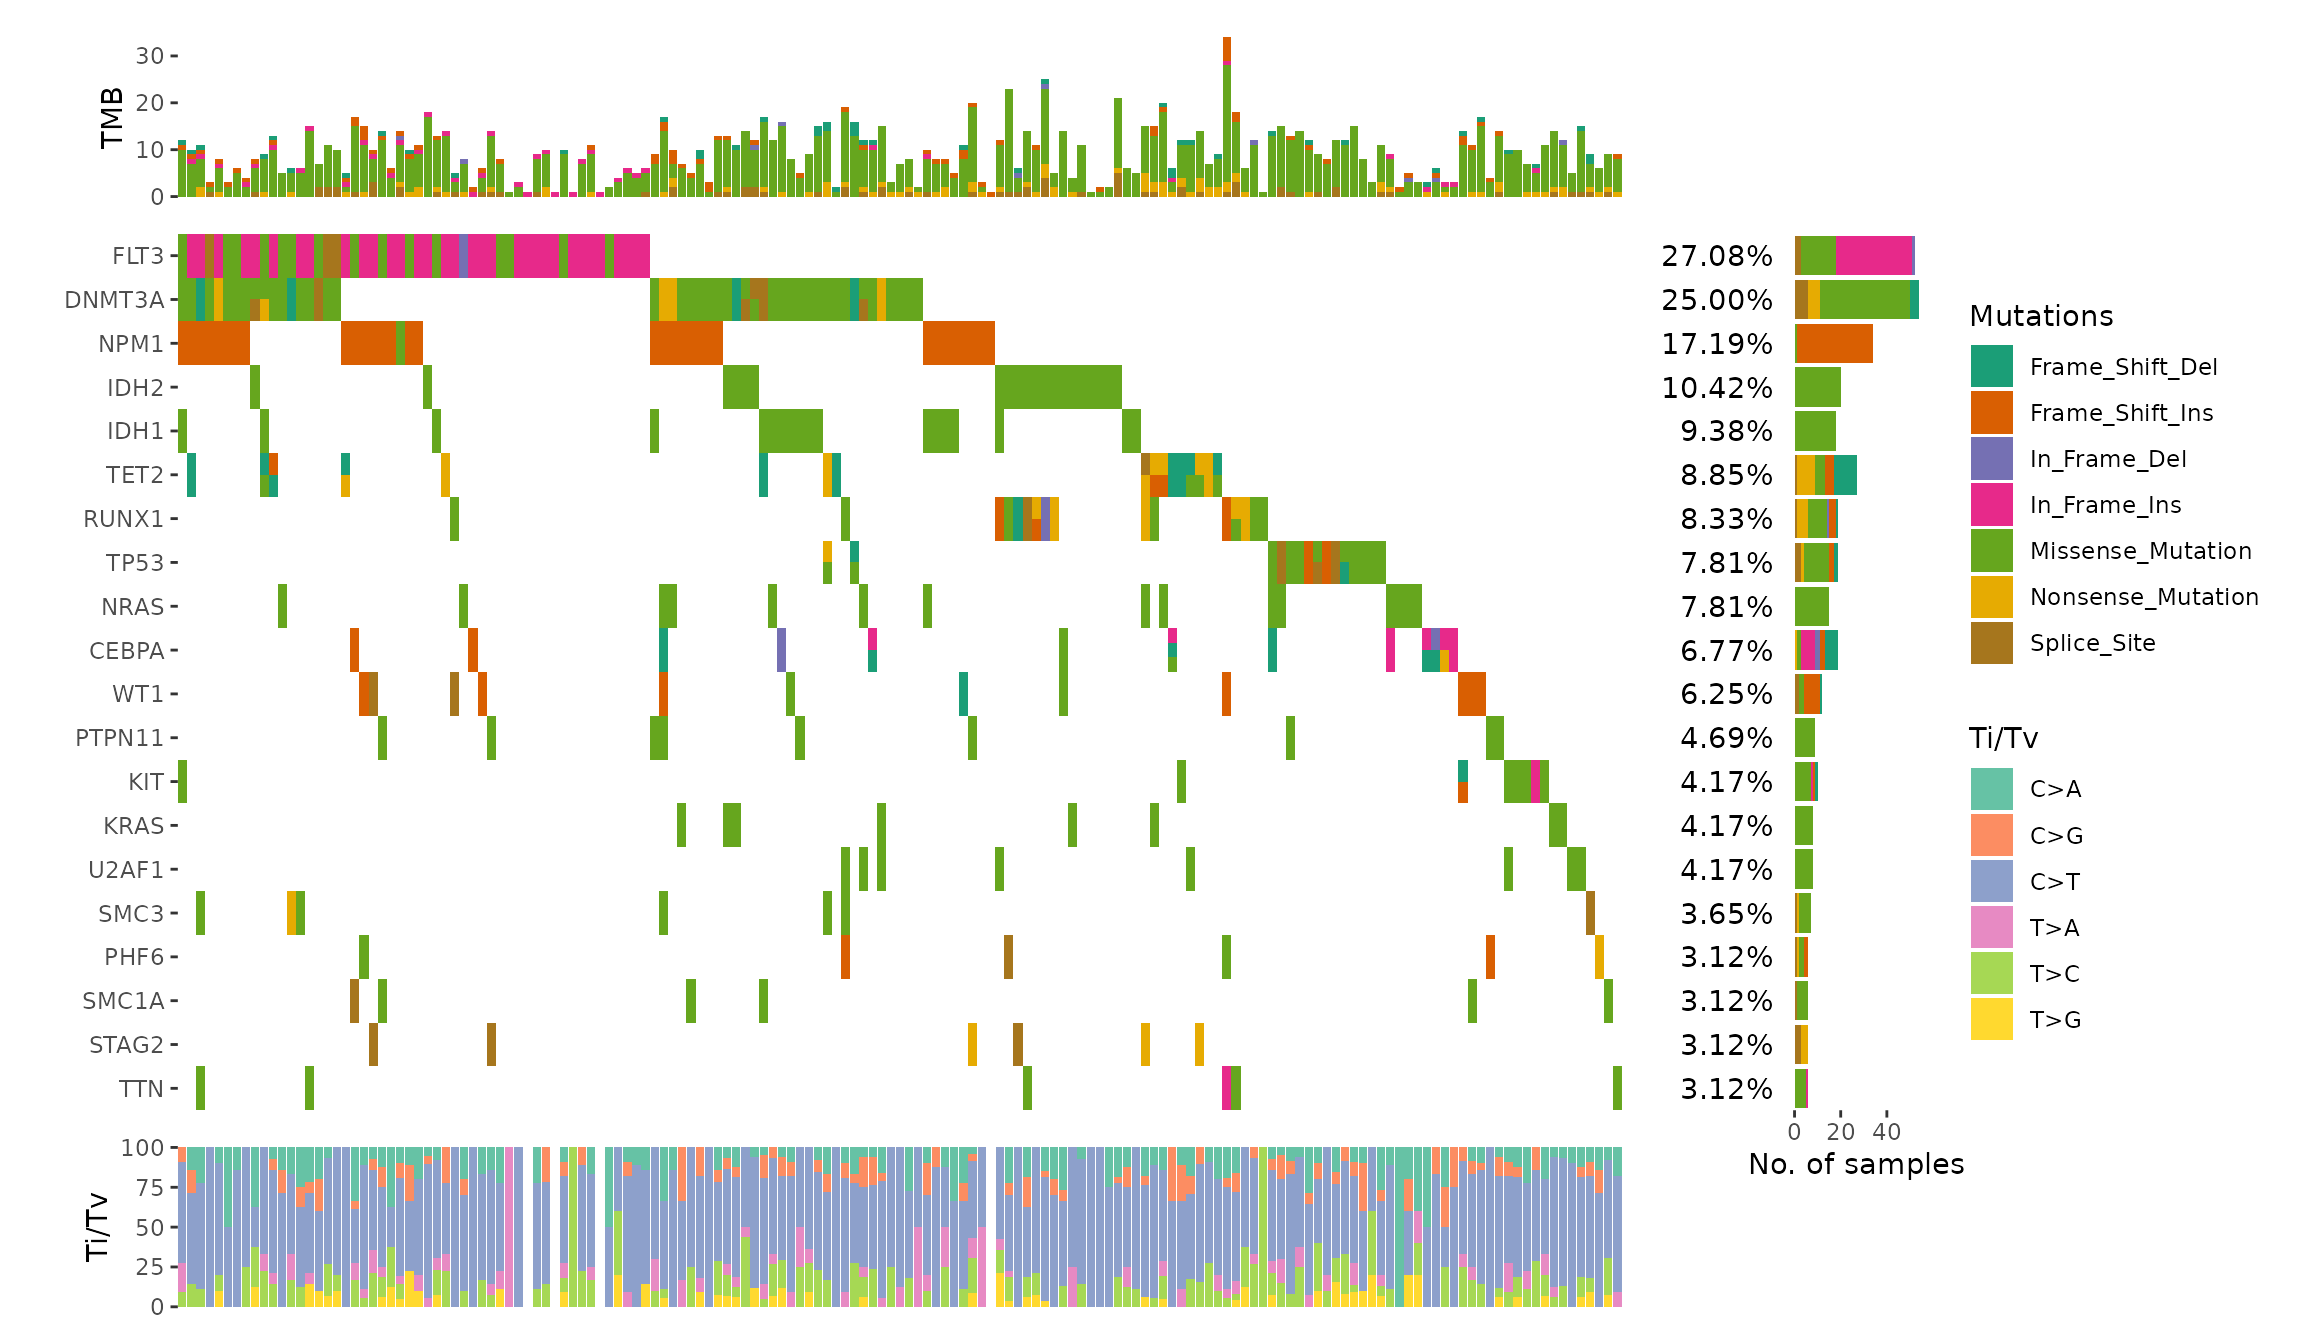
If you want to draw the oncoplot, ggalign provide more advanced function to do this, it can do everything ComplexHeatmap can, and even more!
The oncoplot vignette is here: https://yunuuuu.github.io/ggalign/dev/articles/oncoplot.html
Reasons:
Posted by: Yun - Probably link only (1):
- Contains signature (1):
- Long answer (-0.5):
- Has code block (-0.5):
- Low reputation (0.5):