79261575
Date: 2024-12-07 23:19:55
Score: 0.5
Natty:
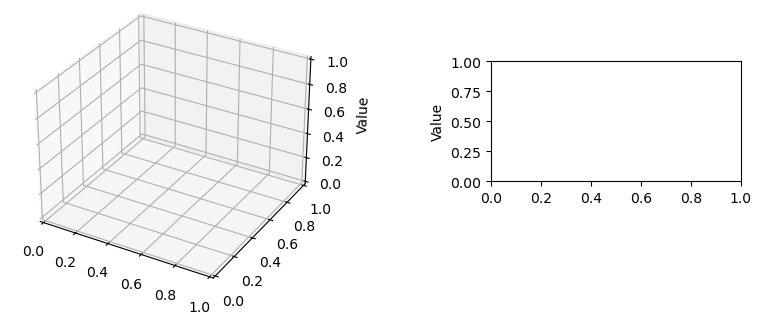
You can use set_position() to change the dimensions of one of the subplot:
plt.figure(1).axes[1].set_position([0.6,0.4,0.25,0.3]) # left, bottom, width, height
Reasons:
Posted by: rehaqds - Whitelisted phrase (-1.5): You can use
- Probably link only (1):
- Low length (1):
- Has code block (-0.5):
- Low reputation (0.5):
