79265166
Date: 2024-12-09 13:39:03
Score: 0.5
Natty:
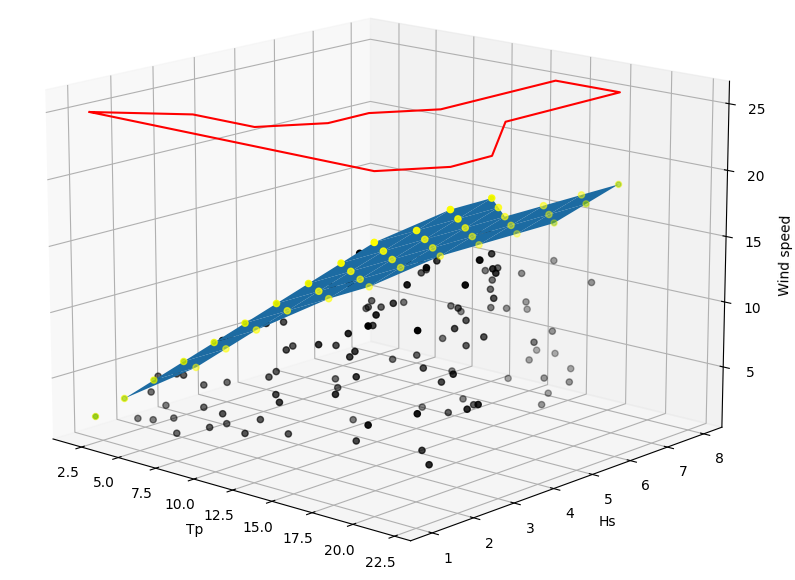
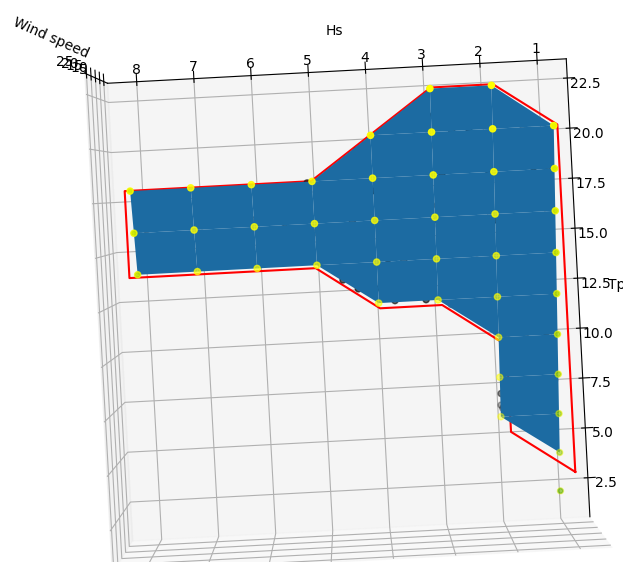
Actually, I split the issue in two steps:
- Generate LHS sampling in the XY plan bounded by a polygon
- For each sampled draw a random Z value bounded by an arbitrary minimum value and the calculated upper Z value.
Below is a MWE for whoever would be interested:
    from random import uniform
    import matplotlib.pyplot as plt
    import numpy as np
    import pandas as pd
    from scipy.interpolate import CloughTocher2DInterpolator as CT
    from scipy.stats import qmc
    from shapely.geometry import Point, Polygon

    data_2d = [
    [2, 4, 6, 8, 10, 12, 14, 16, 18, 20, np.nan],
    [np.nan, np.nan, 6, 8, 10, 12, 14, 16, 18, 20, 22],
    [np.nan, np.nan, np.nan, np.nan, np.nan, 12, 14, 16, 18, 20, 22],
    [np.nan, np.nan, np.nan, np.nan, np.nan, 12, 14, 16, 18, 20, np.nan],
    [np.nan, np.nan, np.nan, np.nan, np.nan, np.nan, 14, 16, 18, np.nan, np.nan],
    [np.nan, np.nan, np.nan, np.nan, np.nan, np.nan, 14, 16, 18, np.nan, np.nan],
    [np.nan, np.nan, np.nan, np.nan, np.nan, np.nan, 14, 16, 18, np.nan, np.nan],
    [np.nan, np.nan, np.nan, np.nan, np.nan, np.nan, 14, 16, 18, np.nan, np.nan],
]
# data_2d: - rows are Hs from 1 to 8 (8 rows)
#          - columns are Tp from 2 to 22 (10 columns)
#          - content is the wind speed from 2 to 22

tp_hs_ws = pd.DataFrame(data_2d)
tp_hs_ws.columns = [np.arange(2, 24, 2)]
tp_hs_ws.index = [np.arange(1, 9, 1)]
x_data, y_data = np.meshgrid(np.arange(2, 24, 2), np.arange(1, 9, 1))

non_nan_coord = [
    (2, 1),(20, 1),(22, 2),(22, 3),(22, 3),(20, 4),(18, 5),(18, 8),(14, 8),(14, 5),(12, 4),(12, 3),(10, 2),(6, 2),(2, 1)]

polygon = Polygon(non_nan_coord)
xp, yp = polygon.exterior.xy

points = LHS_Points_in_Polygon(polygon, nb_points)
xs = [point.x for point in points]
ys = [point.y for point in points]

# Keep only the unique LHS samples
xs = pd.Series(xs).unique()
ys = pd.Series(ys).unique()
xs_grid, ys_grid = np.meshgrid(xs, ys)

# Interpolate initial wind speed on the LHS Hs/Tp grid
zz = []
for z in (np.array(data_2d)).ravel():
    if str(z) == "nan":
        z = 0
    zz.append(z)

xy = np.c_[x_data.ravel(), y_data.ravel()]
CT_interpolant = CT(xy, zz)
Ws = CT_interpolant(xs_grid, ys_grid)

# Select the wind speed associated to the LHS Tp/Hs samples
ws = []
for idx_tp, _ in enumerate(xs_grid.ravel()):
    ws.append(Ws.ravel()[idx_tp])
# Make the LHS samples in square matrix form
ws_LHS = np.reshape(ws, (len(xs_grid), len(ys_grid)))
# The diagonal of wind speed LHS samples is corresponding to the XY coordinates sampled
ws_LHs_diag = ws_LHS.diagonal()

# Create random wind speed between 2m/s (arbitrary lower bound) and the LSH sampled wind speed value (upper bound)
# This ensure to produce a point XYZ always contained with the voume Tp/Hs/Wind speed
random_ws = [uniform(2, ws) for ws in ws_LHs_diag]
The function LHS_Points_in_Polygon is inspired by this solution.
def LHS_Points_in_Polygon(polygon, number):
    minx, miny, maxx, maxy = polygon.bounds
    sampler = qmc.LatinHypercube(d=2, scramble=False)
    sample = sampler.random(n=number)
    l_bounds = np.min((minx, miny))
    u_bounds = np.max((maxx, maxy))
    points = []
    while len(points) < number:
        for x, y in qmc.scale(sample, l_bounds, u_bounds):
            pnt = Point(x, y)
            if polygon.contains(pnt):
                points.append(pnt)
    return points
Below is the outcome:
Reasons:
Posted by: Ryderc - Probably link only (1):
- Long answer (-1):
- Has code block (-0.5):
- Self-answer (0.5):
- Low reputation (0.5):